Interactive Multiple Round Chart: Dynamic Data in After Effects
In the realm of digital storytelling, data often gets a bad reputation for being dry or difficult to digest. However, the Interactive Multiple Round Chart | AE template challenges this notion by transforming raw statistics into a visual experience. This isn't just a static image file; it is a fully customizable motion graphics solution designed for Adobe After Effects. It features a modern, gradient-based aesthetic that brings a level of polish and sophistication to data visualization that is often missing from standard business presentations. Whether you are a seasoned motion designer or a marketing professional looking to enhance your video content, this template serves as a powerful design asset for communicating complex information with clarity and style.
Visual Style and Aesthetic Appeal
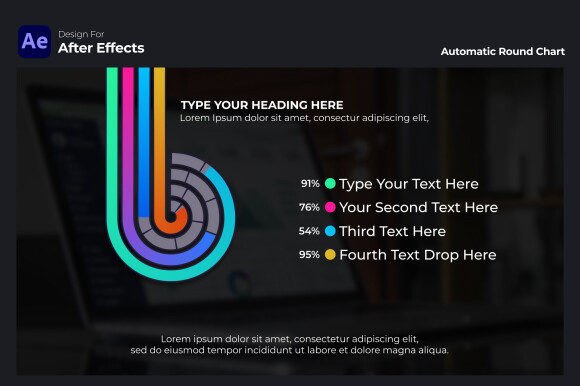
The defining characteristic of the Interactive Multiple Round Chart | AE is its commitment to modern design trends. Gone are the flat, uninspired pie charts of the past. This template utilizes a "round" or radial layout that feels organic yet precise. The visual personality is sleek, professional, and energetic, largely driven by its modern gradient design. Gradients are a staple in contemporary brand identity and web design because they add depth and dimensionality. In this template, gradients aren't just decorative; they help differentiate data sets, making it easier for the viewer to distinguish between different percentages or KPIs at a glance.
Furthermore, the animation style is crucial to its appeal. Data visualization works best when it guides the eye, and the smooth animations included in this template do exactly that. The charts build themselves dynamically, capturing attention immediately. This kinetic energy is essential for social media graphics and video content where stopping the scroll is the primary objective. The aesthetic is versatile enough to fit into a corporate boardroom presentation yet stylish enough for a trendy YouTube intro or a digital art installation.
Practical Applications and Use Cases
Understanding where to deploy the Interactive Multiple Round Chart | AE is key to maximizing its value. For entrepreneurs and small business owners, this template is indispensable for creating pitch decks and quarterly reports. Instead of presenting a static slide with numbers, you can render a video snippet showing your company’s growth trajectory or sales targets being met. This adds a layer of professionalism and confidence to your narrative.
For content creators and bloggers, the applications are equally broad. Imagine breaking down survey results for your audience or visualizing the success rate of a specific tutorial. The template excels in:
- Business Presentations: Visualizing KPIs, project success statistics, and financial targets.
- Educational Content: Explaining statistical data or scientific results in an engaging format.
- Marketing Videos: Showcasing customer satisfaction scores or market share analysis.
- Social Media Content: Creating short, looping graphics that highlight achievements or poll results to boost engagement.
Because it is an After Effects project, it integrates seamlessly into video editing workflows. You can render the charts with a transparent background (Alpha channel) and overlay them onto footage, or use them as standalone segments within a larger presentation.
Deep Dive into Customization and Control
What sets a premium template apart from a basic graphic is the level of control it offers the user. The Interactive Multiple Round Chart | AE is built on a foundation of user-friendly controls that democratize the design process. You do not need to be an expert in After Effects expressions to make this work for you.
Fine-Tuning Your Data
The core utility of this tool is data representation. The template allows for extensive customization options, specifically regarding the data points themselves. Using intuitive slider controls, you can adjust the chart percentages with high precision. This is particularly useful for displaying decimal values (e.g., 12.5% or 45.9%), ensuring that your data visualization is accurate and trustworthy. Whether you are tracking sales data, survey results, or performance metrics, the sliders allow for real-time adjustments without manually keyframing paths.
Background and Color Integration
Visual consistency is vital for brand identity. The template includes a robust set of background controls accessible via a dropdown menu. This allows you to instantly switch between five distinct styles:
- Solid Background: For clean, minimalist looks.
- Media Background: To overlay charts on video footage or images.
- Linear & Radial Gradients: To match specific brand color schemes or create atmospheric depth.
- Transparent Background: Essential for compositing the charts into other video projects.
Beyond the background, the color controls are fully customizable. You can easily tweak the colors of the text, the chart segments, and other UI elements to match your client’s palette or your own creative vision. This ensures that the chart feels like an integrated part of your project rather than an off-the-shelf add-on.
Technical Considerations and Workflow Tips
When incorporating the Interactive Multiple Round Chart | AE into your workflow, consider the broader context of your typography and layout. While the template handles the data visualization, the text elements surrounding it should complement the modern aesthetic. Pairing the chart with a clean sans serif font often works best for readability, especially when displaying small percentage numbers or labels. However, if your brand relies on a specific serif font for headings, the chart's clean lines will provide a nice contrast without clashing.
From a technical standpoint, this template is a great example of functional motion graphics. It is designed to be a "set and forget" tool once customized. If you are working on a series of videos, you can customize the master controls once and save a preset, or duplicate the composition and simply change the slider values for different data sets. This workflow efficiency is invaluable for marketers and designers working under tight deadlines.
Ultimately, the Interactive Multiple Round Chart | AE is more than just a visual aid; it is a storytelling device. By animating your data and presenting it within a sleek, gradient-rich environment, you elevate the perceived value of the information you are sharing. It bridges the gap between dry statistics and compelling visual content, making it an essential tool for anyone serious about professional digital communication.